MEREDITH LYON
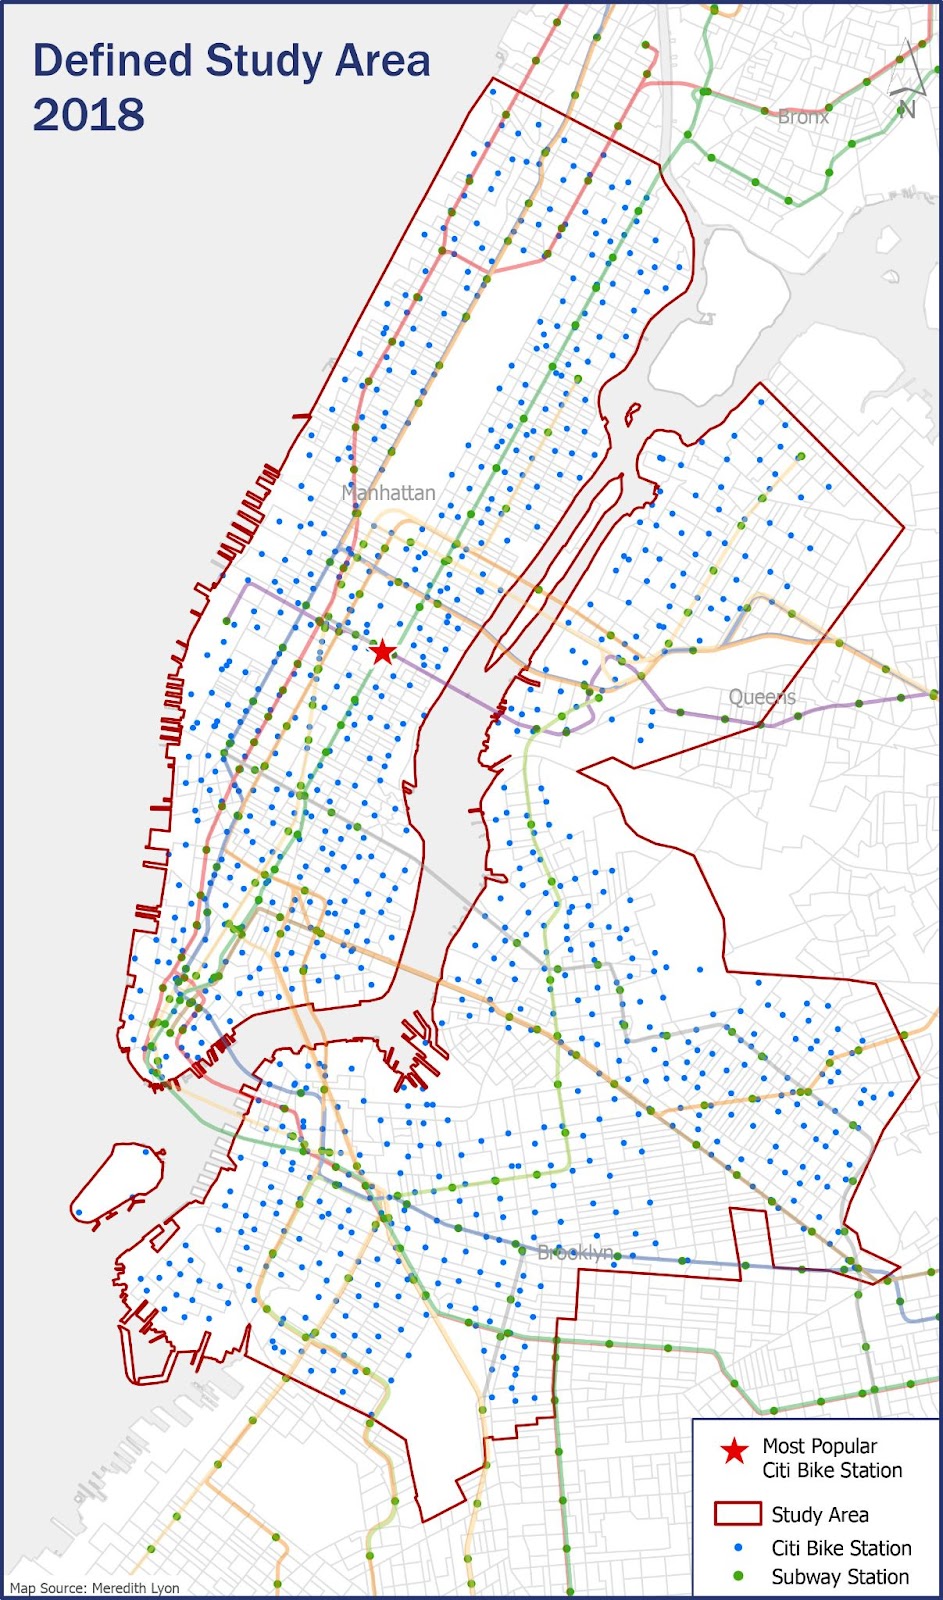
Defined Study Area Map showing Manhattan, Queens, and Brooklyn, credit: Meredith Lyon
Worldwide bike-share services such as Citi Bike are an increasingly available alternative transportation mode that provides an additional mobility network throughout cities. Citi Bike, a public-private partnership between NYC Department of Transportation and Lyft, provides bicycle access to hundreds of thousands of New Yorkers and visitors alike. In 2018 there were 20,551,697 Citi Bike rides taken throughout Manhattan, Brooklyn, and Queens, and since then, ridership has only grown. The Defined Study Area 2018 map shows, in red, the edges of the Citi Bike service area in relation to subway lines.
As cities encourage more transit use and lower car dependency, the bike to intermodal transit model is particularly important to achieve environmental and socio-economic balance.
First/last mile solutions connect people to transit options when they reside outside of a station’s one mile catchment area. Communities’ disconnection from accessible mass transit often results in car dependency, which consequently produces an undue economic burden on the lower-income citizens and negatively impacts the environment.
This article is a brief overview of a larger study investigating the relationship between Citi Bike and subway ridership in New York City in 2018. The focus of this piece is how the location of Citi Bike docking stations and ridership relates to boarding and alighting (deboarding) rates of nearby subway stations.
RESEARCH DESIGN AND METHODS
Each month, Citi Bike publicly discloses data on each individual ride. The dataset includes trip information such as duration, start and end station location(s), subscription status, and rider demographics. Additionally, MTA subway ridership rates are publicly available. For this research the Citi Bike individual trip data was combined and the respective longitude, latitude, ride origin, and end counts for each docking station were plotted. These findings were used to produce a Citi Bike Origin-Destination Trip Matrix in relation to the subway station boardings and alightings. Due to the high volume of unique Citi Bike trips, only origin-destination pairs (start and end points/stations) that acquired more than 1,500 journeys were represented.
SUBWAY RIDERSHIP & CITI BIKE ROUTE ANALYSIS
As displayed in the Subway Ridership & Citi Bike Trip Routes 2018 map, higher subway boardings per station rates correspond with Citi Bike trips, suggesting that Citi Bike ridership provides a first/last mile linkage. The Dekalb Ave station (Inset D) has relatively high subway boarding (indicated by the green circle), and a high level of Citi Bike trips extending east into the low transit serviced Fort Greene neighborhood (indicated by the red and blue lines offshooting the green circles). This Citi Bike route trend is also seen in Williamsburg (Inset C) radiating around the highly utilized Bedford Avenue and Graham Avenue stations. Citi Bike trips extend to areas with fewer and more dispersed subway connections. Additionally, Astor Place and Union Square stations (Inset B) have high levels of trips reaching eastern Manhattan, again in neighborhoods with limited subway services. Similar but less distinct trends are present along the Nostrand Avenue station radiating into central Bedford Stuyvesant and the Ditmars Boulevard station in Astoria.
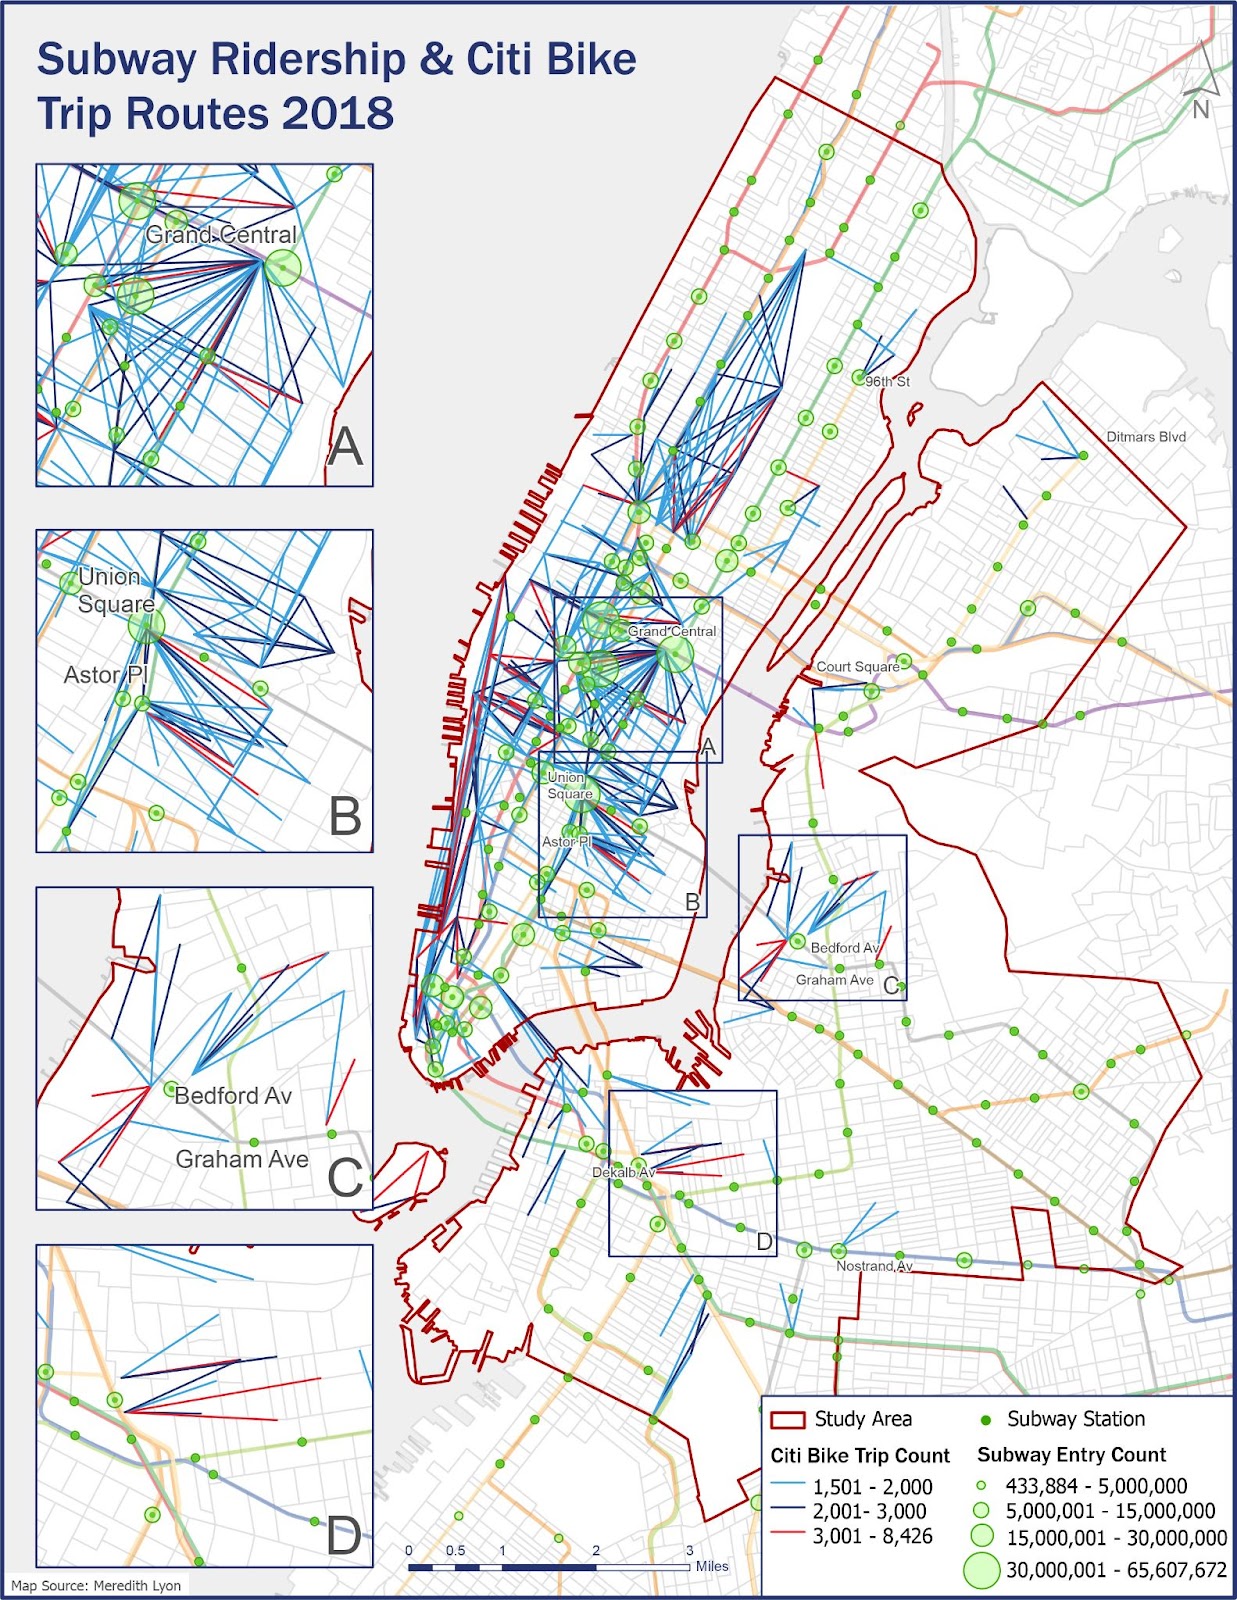
The green circles correspond with subway ridership counts. The red and blue lines represent non-directional Citi Bike origin-destination trips.credit: Meredith Lyon.
Subway stations that appear to correlate with high levels of Citi Bike routes also have relatively high boarding rates. Spatial analysis suggests that Citi Bike is potentially used as a first and last mile connector to people residing or beginning their journey further from subway stations.
While the visual correlation between the origin and end count for Citi Bike ridership and subway boarding and alighting counts is apparent, statistically it was also significant with a 35% prediction power. Essentially, there is a 35% chance that as the Citi Bike trip starts and ends increase, then ridership at corresponding subway stations increases.
SUBWAY RIDERSHIP & CITI BIKE STATION PROXIMITY ANALYSIS
Conversely, the Subway Ridership & Citi Bike Station Proximity Count 2018 map shows no discernible trend between subway boarding levels and the number of Citi Bike stations within proximity to the subway station. High numbers of subway boardings within midtown and downtown Manhattan appear to have a relationship between Citi Bike ridership and docking station counts. Still, the apparent trend is unlikely to be significant due to the high volume of commuters within those areas.
Multivariate regression analysis (modeling the linear relationship between more than one independent variable and more than one dependent variable) showed that there was no correlation between the number of Citi Bike stations within the 0.125 mile buffer surrounding the subway station. This implies that subway ridership is not influenced by Citi Bike infrastructure alone.
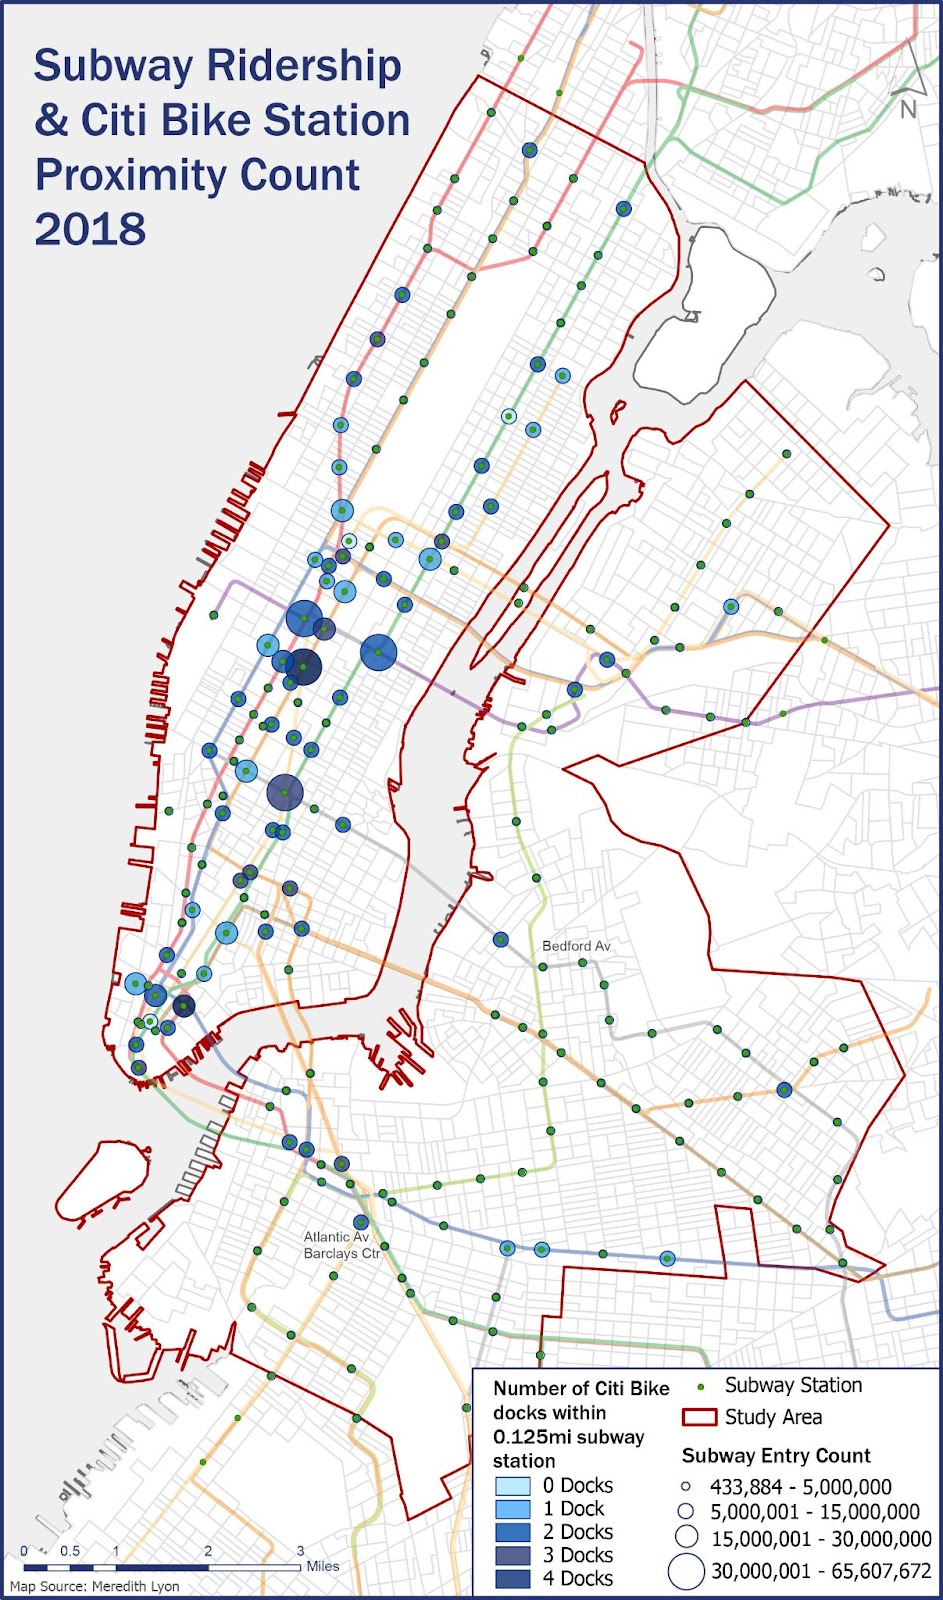
The circle size corresponds with subway ridership counts. The colors indicate the number of docking stations within 0.125-mile proximity of the subway station, credit: Meredith Lyon.
THE FUTURE OF CITI BIKE
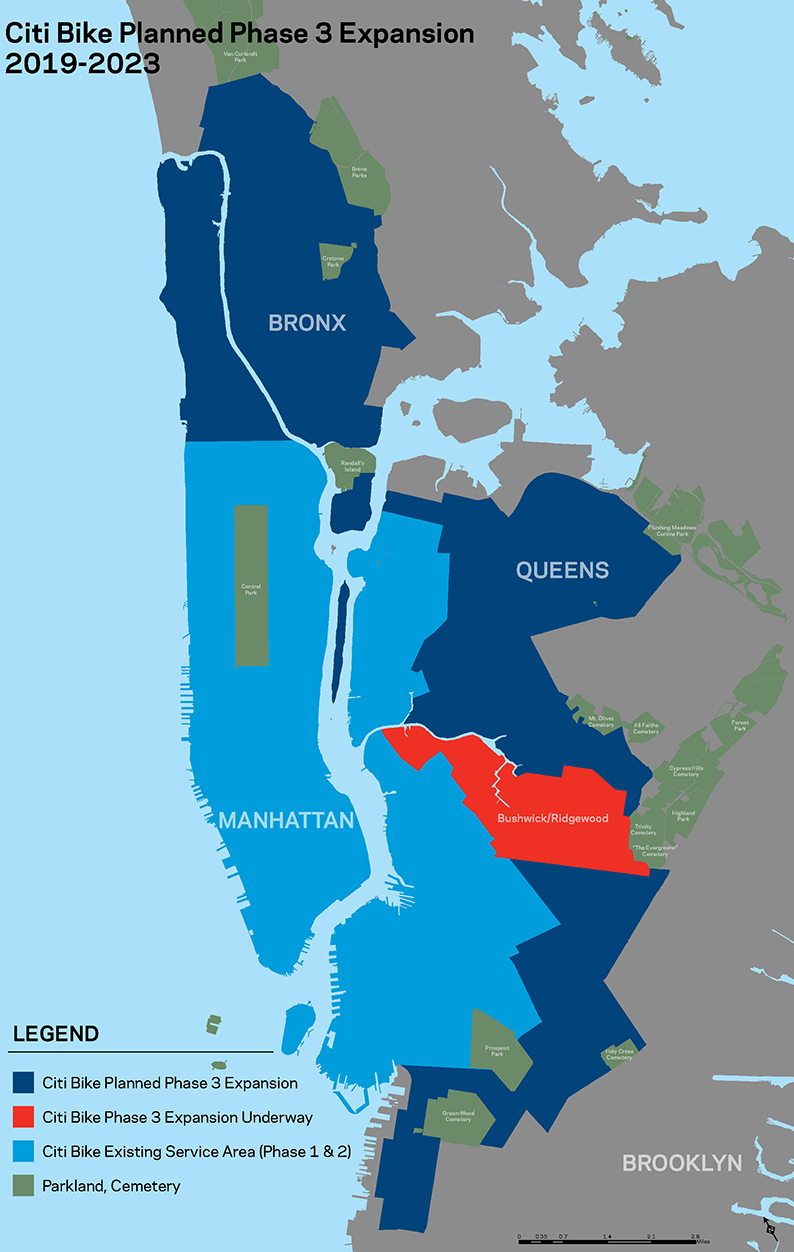
Citi Bike Planned Phase 3 Expansion 2019-2023 map, courtesy of Lyft, licensed under CC BY-NC-SA 2.0.
Citi Bike announced a sizable expansion of docking stations facilities that will be fully implemented by 2023, as outlined in the Citi Bike Planned Phase 3 Expansion 2019-2023 map. The plan extends services further into Queens and Brooklyn as well as into upper Manhattan and South Bronx.
The map Subway Walking Access & Citi Bike Expansion Plan, below, illustrates the current conditions within a seven minute walking catchment area of subway stations in the 2018 study area. The areas outside the study zone, where Citi Bike service will expand in the future, have larger gaps between subway stations. The evident disparity in access to subway stations indicates a higher need for first/last mile solutions that Citi Bike expansion could provide.
The Bicycle Infrastructure & Citi Bike Expansion Plan, below, displays the existing bike path network encompassing protected lanes, striped lanes, and sharrows. The protected lanes offer the highest level of safety by providing a physical barrier that separates the cyclist from traffic. The striped lane, which separates and designates a path exclusively for cyclists, is slightly less safe compared to the protected bike lane but still effective.
Sharrows provide the least protection for cyclists by marking the pavement in the street with a bicycle icon to indicate the safest place within active traffic to ride. Areas that reside outside of the 2018 study and corresponding Citi Bike docking stations have significantly fewer bike routes, low levels of protected or striped bike lanes and almost no sharrows.
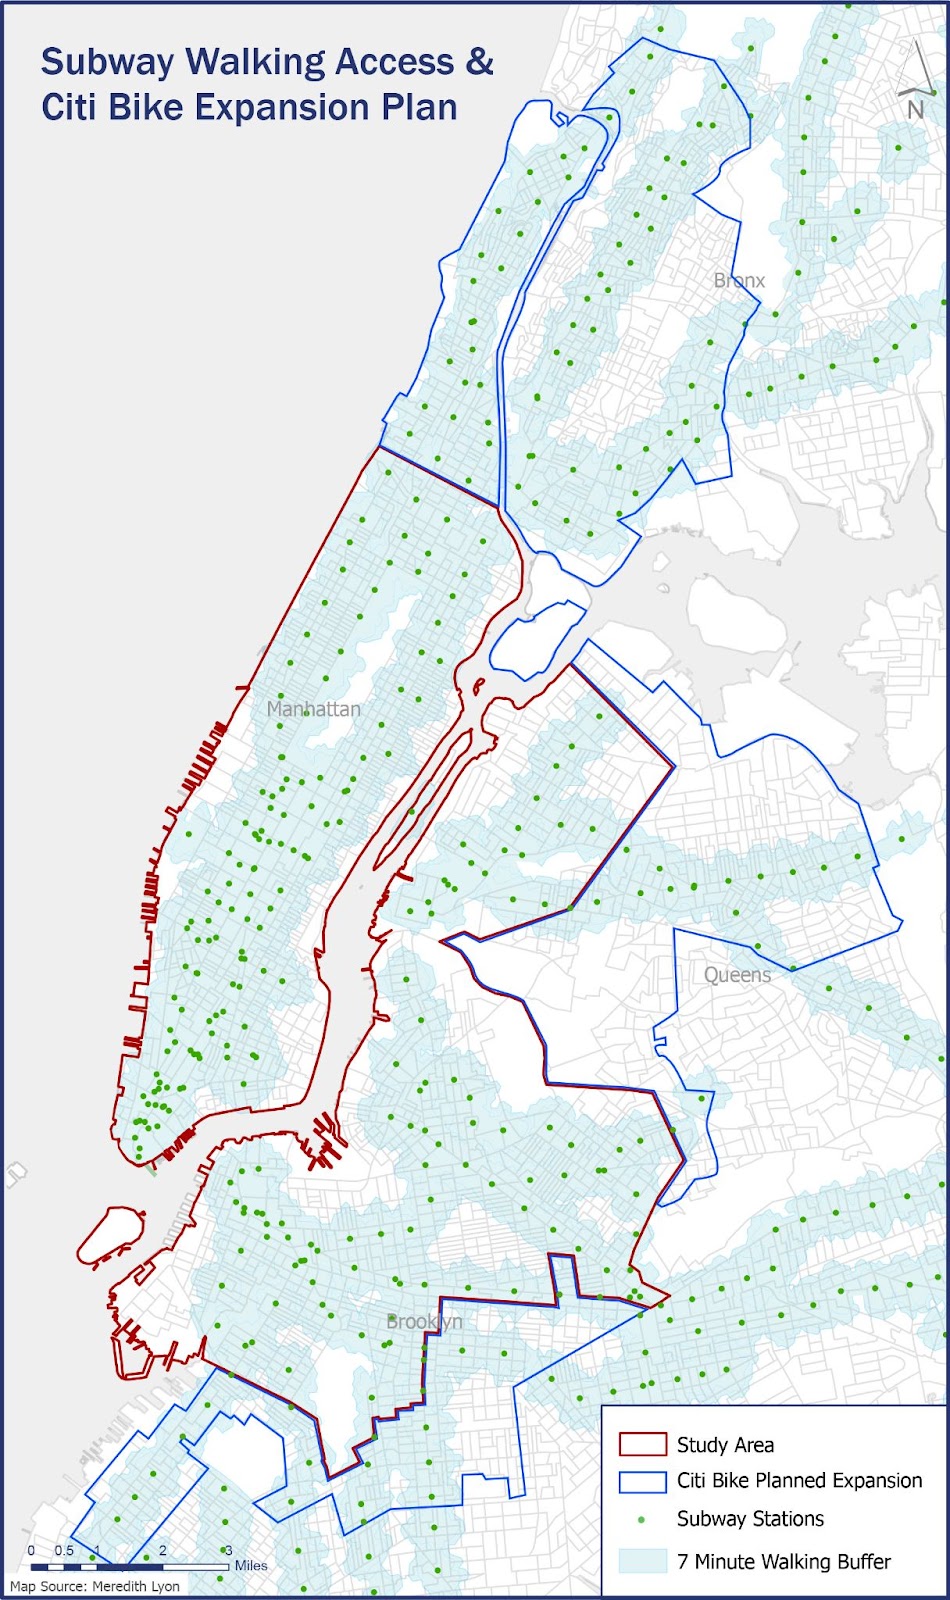
The green dots represent the subway stations, and the light blue indicates a 7-minute walking buffer from the corresponding stations, credit: Meredith Lyon.
As outlined in the statistical analysis, Citi Bike infrastructure alone does not drive Citi Bike ridership rates. A 2019 survey conducted in England found that safety concerns were the highest-ranking factor in why people chose not to ride a bike in the city. The survey found that 24% of people avoided riding a bike due to road safety concerns. Another 16% cited that there was too much (vehicular and pedestrian) traffic and traffic was moving too fast (Department for Transport, England 2019). This suggests that perceived safety and safety infrastructure, such as bike lanes, traffic calming, and pedestrian leading intervals, can impact a citizen’s inclination to choose cycling as a mode of transportation.
For Citi Bike to be an effective first/last mile conduit, Citi Bike users must have access to safe bicycle routes and street conditions. Improved bicycle infrastructure would address some of the trepidation that citizens have about riding a bike in the city and make it more likely that citizens who need a first/last mile connector to take advantage of Citi Bike services.
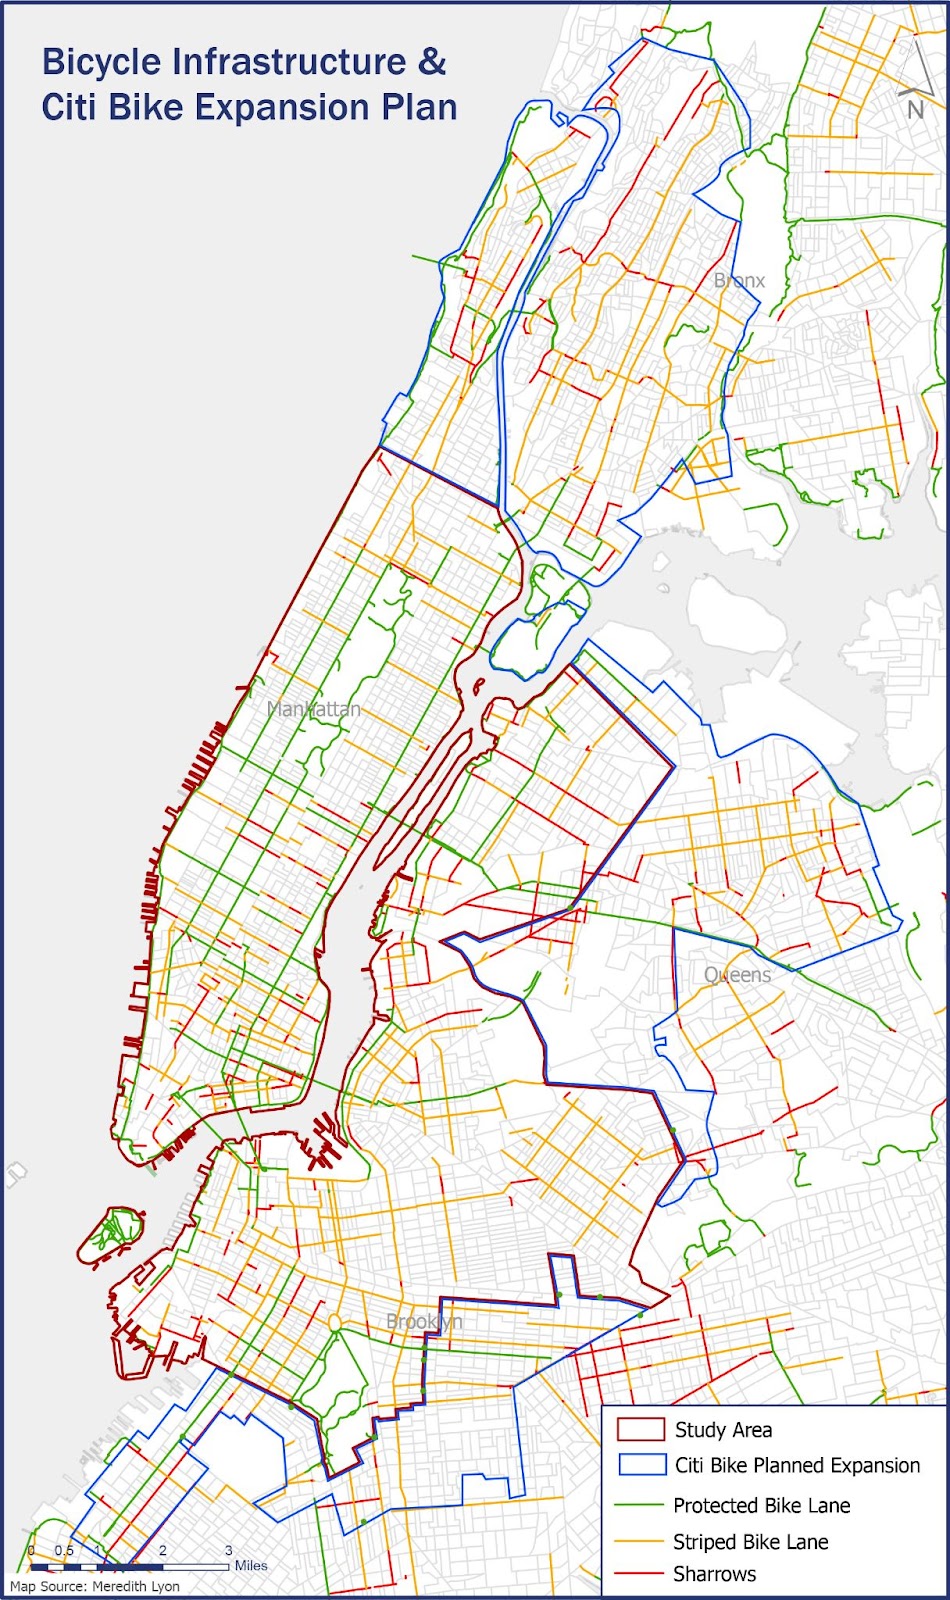
The green, yellow and red lines indicate different levels of bicycle infrastructure throughout the city based on the protection level it provides, credit: Meredith Lyon.
This Spring 2022 semester, I plan to expand on this research and focus on the implications of safe bicycle infrastructure and Citi Bike ridership. As New York City approaches the final phase of the Citi Bike expansion in 2023, it is essential to understand what drives Citi Bike/overall bicycle ridership to implement policies that support cycling as a greener and more accessible transportation mode in the city. The next stage of this research is to interpret the origin-destination and ridership rates of Citi Bike in 2021 and the station’s relationship to the proximity of protected, separated, and sharrow bicycle infrastructure.
Meredith Lyon is a graduate student in the Master of Urban Planning program at Hunter College. Her research interests focus on spatial analysis and transportation planning. She is currently interning at the MTA, working on the Bike, Pedestrian, and Micromobility Strategic Action Plan. She can be found at meredithlyon.com.