Zhi Keng He
Looking back on my childhood and even my early twenties, I can hardly believe how unaware I was of the city surrounding me. My younger self had not the slightest comprehension of what makes New York City run – the services it provides to its residents or how they are funded. I was unaware that I was consuming municipal services on my daily bus ride to school, or that I was, in some way, funding the delivery of these services while helping my parents with their property taxes or filing for benefits on their behalf. The city’s services define our urban existence: the tolls across bridges for summer vacations, the wonderful green spaces we cherish, and the many services that any resident knows and expects (i.e., education, health, sanitation, safety, transportation, etc.).
My awareness and appreciation of municipal services was of course in large part simply a matter of growing up. However, as an undergraduate at Hunter, I first became aware of holes in the delivery of municipal services. I remember completing GIS lab assignments for my undergraduate degree in geography. Even then, however, I didn’t understand the complexity of planning and policy. When asked to identify through GIS a better transportation system to connect residents to regional airports, I concocted a strange analysis devoid of civic understanding: building a canal system through the landmass of Queens to connect the airports (what was I thinking). I didn’t fully appreciate the depth of city services until I delved deep into municipal open data. My journey with 311 data helped me grow as an urban planner. A large part was understanding how the data was being generated, used for creating change and becoming passionate about getting more people involved in learning to use 311 data to co-create a better city.
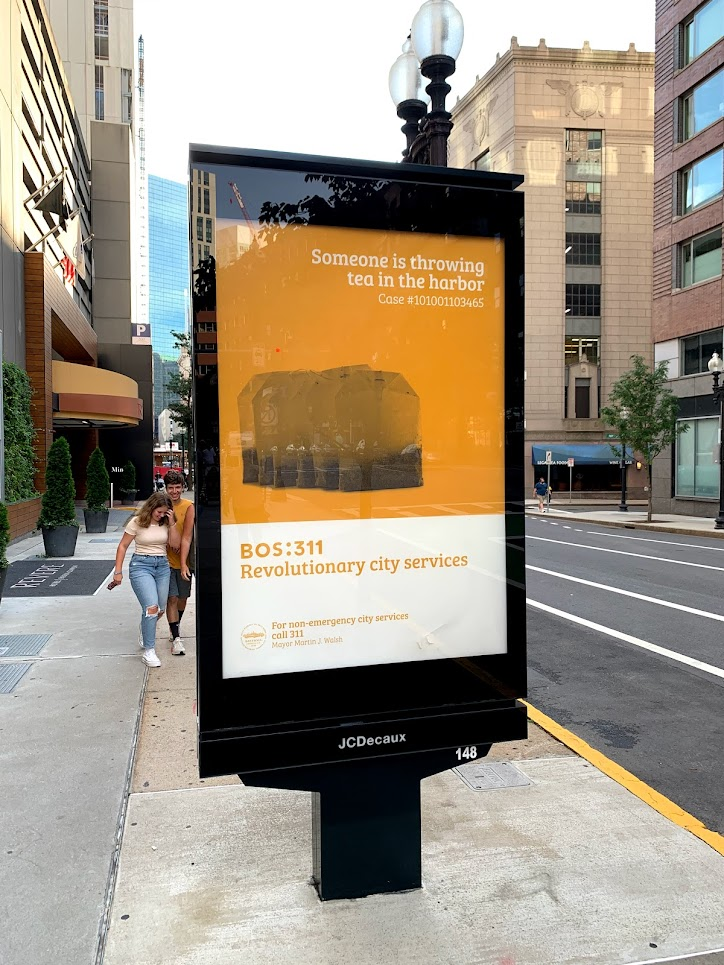
Photo of 311 digital ad taken in Boston. The top reads: “Someone is throwing tea in the harbor; Case #…” [a photo of tea bags with an orange background] The bottom: “BOS:311 Revolutionary city services. For non-emergency services call 311.” Credit: Zhi Keng He
311 and its data
Many New Yorkers’ first direct interaction with city services comes in the form of a 311 request. Submitted via a phone call or through the website or mobile app, a 311 request can either be a service request or a complaint. 311 requests encompass a broad range of facets of municipal services. The most common relate to buildings (heat and hot water or noise issues), streets (blocked driveways or bike lanes), or more generalized requests for information regarding snow days, trash pick-ups, and Pre-K sign-up deadlines. 311, however, is also used for more specialized purposes, such as requesting help for the homeless, water testing kits, or new street tree plantings. It is truly a system that anyone, in (most) languages, can call, text, or message on social media and get (somewhat) a response from the large, and often impersonal bureaucratic city government. In April 2023 alone, 311 logged some 238,792 requests, in what is often one of the service’s slower months. Requests peaked during the COVID-19 pandemic, reaching 337,672 in August 2020.
The Open Data Law in 2012 made datasets like 311 requests data publicly accessible. Over its many years, 311 data has emerged as a tool for the general public to see their own requests, and the needs of their neighbors, and analyze trends in city services as they interact with their communities; how many issues are being reported? What needs improvement? And, importantly, what areas are being neglected in the delivery of services? This “People’s Dataset” provides invaluable insights into what city residents are experiencing in their daily lives, collectively generated by New Yorkers.
311 data analysis
My first encounter with 311 was through its data in an “Introduction to GIS” class. It was a classic example of where 311 data analysis can go wrong. The subject of the exercise was analyzing 311 rat/rodent complaints. With the dataset’s abundance of columns, it provides easy ways to roll up and pivot the data to show trends by different administrative boundaries. Analysis like heat and choropleth maps depicting counts by Census tracts is slightly more advanced, but still can easily created with a session in GIS software. With this cursory analysis, conclusions can be drawn as to where the city might want to target its rodent remediation efforts…
However, when the professor asked who might most likely report rat sightings using 311, no one in the classroom raised their hands. This led to a discussion on how 311 reports have an innate reporting bias – something that a user of 311 might not readily realize. In short, groups that are more civically engaged tend to skew whiter and more affluent; a correlation that plays out spatially in visualizing 311 complaints by neighborhood. Underlying much 311 data is a bias towards the affluent New Yorkers who constitute the “power users” of 311 data.
Further frustrating 311 are the responses generated by requests. Often, certain complaint filings yield unhelpful generic responses. Stock 311 responses include “Observed no evidence of the violation at that time” and “Upon arrival, those responsible for the condition were gone.” Responses can also be long, ranging from a few hours (in a good case) to a few days to close out, stretching into weeks and beyond.
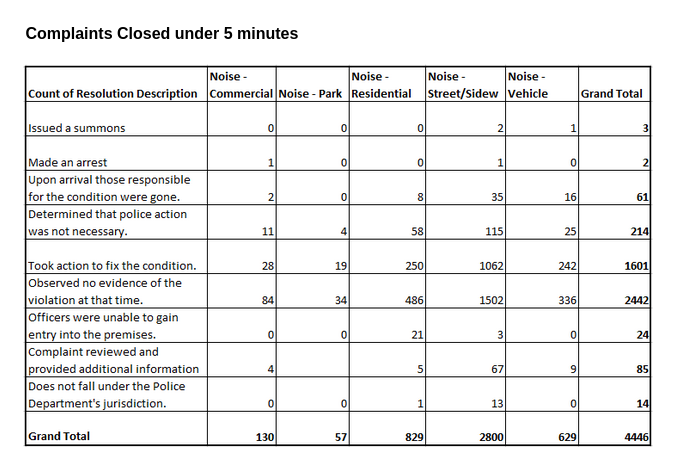
Table of 311 Noise Complaint Resolutions Closed Under 5 minutes in Manhattan CB11 during select pandemic months. Most requests are closed with the message “Observed no evidence of the violation at that time,” credit: BetaNYC.
Like many, these issues – both on the reporting side and the response side – undermined my trust in 311 as a platform: I did not report any of the issues I saw. Similarly, my faith in the use of 311 data for the analysis of neighborhood trends was likewise diminished. I felt that any type of statistic or visualization would only invariably present biased data. The use of such fundamentally flawed analyses would only serve to strengthen existing inequities in the delivery of municipal services, allocating additional resources to affluent areas where serial 311 users live, to the detriment of low-income communities, which tend not to use 311 as heavily. All the same, I continued to use some 311 data for analysis and reports in my work, but I was always sure to include large disclaimers in the text and graphics.
Even before the pandemic, noise issues were a top complaint. During the pandemic, noise complaints grew nearly two times above pre-pandemic levels. With so much more data that needs to be analyzed for my work, COVID-era 311 data presented me with the opportunity to see and explore 311 in a different context. Working with a community group in Washington Heights and Inwood, Respectful Decibels, we did the typical analysis to show the change in volume for noise-related 311 complaints compared to previous years, as well as showcasing the difference in complaint volume in Washington Heights and Inwood compared to other districts. Despite the community’s own awareness of the flawed nature of 311 data via confirmation bias – and the related issue of leveraging analysis of the data for advocacy, as well as issues related to enforcement and response time, – the community continued to lean further into 311, with community organizations encouraging more residents to file. At first, I was confused as to why the residents would submit requests in vain, knowing as they did that these requests rarely led to favorable outcomes. Slowly, after a few task force hearings and meetings with community groups, I began to understand their strategy: the use of 311 data for neighborhood advocacy and as an indirect tool for change.
How does 311 work?
When you file a request, the 311 system (operated by the Office of Technology and Innovation) will forward it to the responsible agency. The agency will have its own system – sometimes it can be centralized in an agency office, but in the case of large agencies like the NYPD, requests are forwarded to the local precinct or sectors to be dispatched to patrols. The processing of 311 requests can vary based on various factors, such as the dynamics of inner precincts or the larger geographies of police districts and regions, city agency policies regarding 311, internal processes, and the capacity of any given entity to respond to the request.
It makes sense that a city as large as New York doesn’t process its 311 intakes from a central point. However, with our technology today, much improvement can be made in how 311 requests are processed, with greater clarity and transparency regarding the following steps to 311 requests, and what is going on behind the scenes. From a community perspective, 311 today is a black box; a bureaucratic monolith that lacks transparency and does not engage in the responsiveness a city should offer its residents. If 311 is to fulfill its aims in both democratizing the delivery of services while simultaneously improving accountability and transparency to residents, the system must embrace technology to grow and change. Therefore, highlighting and communicating 311’s many moving parts is key to not only improving the system but growing civic knowledge and building capacity, encouraging New Yorkers in knowing how to key into some of the issues they most frequently face. Building a better system that allows for complete transparency in its operations will be instrumental in achieving this outcome.
On the surface, Respectful Decibels used the 311 noise data for press reports and during their meetings to reinforce what they already knew: The advocates embraced 311 data to quantitatively validate their argument that noise in Washington Heights and Inwood frequently reached inappropriate levels. The group showcased the large volume of noise complaints in Manhattan Community Districts 9 and 12 to emphasize the scale of the quality-of-life issue that residents were reporting and to underscore that the NYPD was not being responsive to resident complaints. 311 did not necessarily represent a reliable number (as previously discussed, the organization itself encouraged the data’s pre-existing reporting bias), but to city officials, the volume of complaints demanded a response. By submitting a 311 complaint, residents create a record, although one that’s not necessarily etched in stone or that will result in a meaningful response, but a record that will nevertheless require the few city employees tasked with its response to check a box on a tablet, or maybe check it in-person and log it into the system. Furthermore, the record can be augmented by other forms of media such as images or video attachments, or other datasets that strengthen the claim’s validity.
As the volume of 311 complaints increases, so does the ability of community groups to use the data as a tool for advocacy. Community groups can point to the mound of 311 complaints generated by residents to highlight a pressing neighborhood issue that is going unaddressed by public authorities. These charges are often underscored with rhetoric on how the services are funded through residents’ tax dollars and how calls for repairs or enforcement are unmet. These arguments can then, in turn, be picked up as a story by the press, or as a topic of interest on Twitter, and begin to generate blowback against the city government. In this strategy, then, 311 realizes much potential (despite chronic issues in reporting and enforcement) for a data-centered advocacy approach. Community issues can gain momentum which often results in the creation of a task force that opens engagement with city agencies, elected officials, and community members to push the issue and to begin discussing policy change.
While the co-option of 311 data for opportunistic community advocacy is not necessarily bad, it is frustrating to see that the primary means by which a resident asks for services is fundamentally not working and that the primary utility of the data generated by the system is to strengthen claims made by relatively affluent stakeholders. This is not merely a personal gripe: using 311 has far-reaching implications at a building, neighborhood, or city-wide level. At its best, 311 complaints can connect residents with services and, more broadly, the data it generates can help to dictate and inform city policy and budgeting – two arenas in critical need of reform. Given this reality and the present state of 311, it is on us as New Yorkers of all ages, incomes, and ethnicities to step up and learn more about this vital system.
Engagement
When I started my job at BetaNYC as a teaching assistant, the first thing we did with our cohort of undergraduate fellows was have them file 311 reports and then have them describe their experience. Our fellows were CUNY undergraduate students that had largely never deeply engaged in civic matters, much like I had been as an undergrad. Our fellows then experienced the typical 311 patterns. Their complaints yielded largely unhelpful stock responses which came either the following week or after multiple weeks of waiting. This led to a discussion among the cohort about how the city operates and what other datasets and lived experiences the 311 complaints could be augmented to better illustrate the reality of New Yorkers’ daily lives. After some training on data analysis and GIS, we partnered with community boards and community groups to begin discussing how 311 can be fixed and reimagined, and to draw up ideas on new directions for 311 policy.
The 311 system, while an important tool to request and receive services from the New York City government, is far from perfect. In addition to problematizing 311, I’ve discussed several possible paths to improve it here. These include increasing access to 311 through data literacy, not only using data but understanding its implications in reporting, and increasing public trust in the system by improving responsive communication from the responsible agency, incorporating transparency at every stage, and auditing agencies when necessary.
Below I detail specific steps residents can take to both promote the equitable use of 311 data and to ensure an appropriate official response better. However, this only provides a starting point to understand the issues endemic to the current 311 systems. Action comes from learning and understanding the systems and our communities so that policies can be crafted to address the systemic flaws in service delivery that lead to repeated requests in the first place.
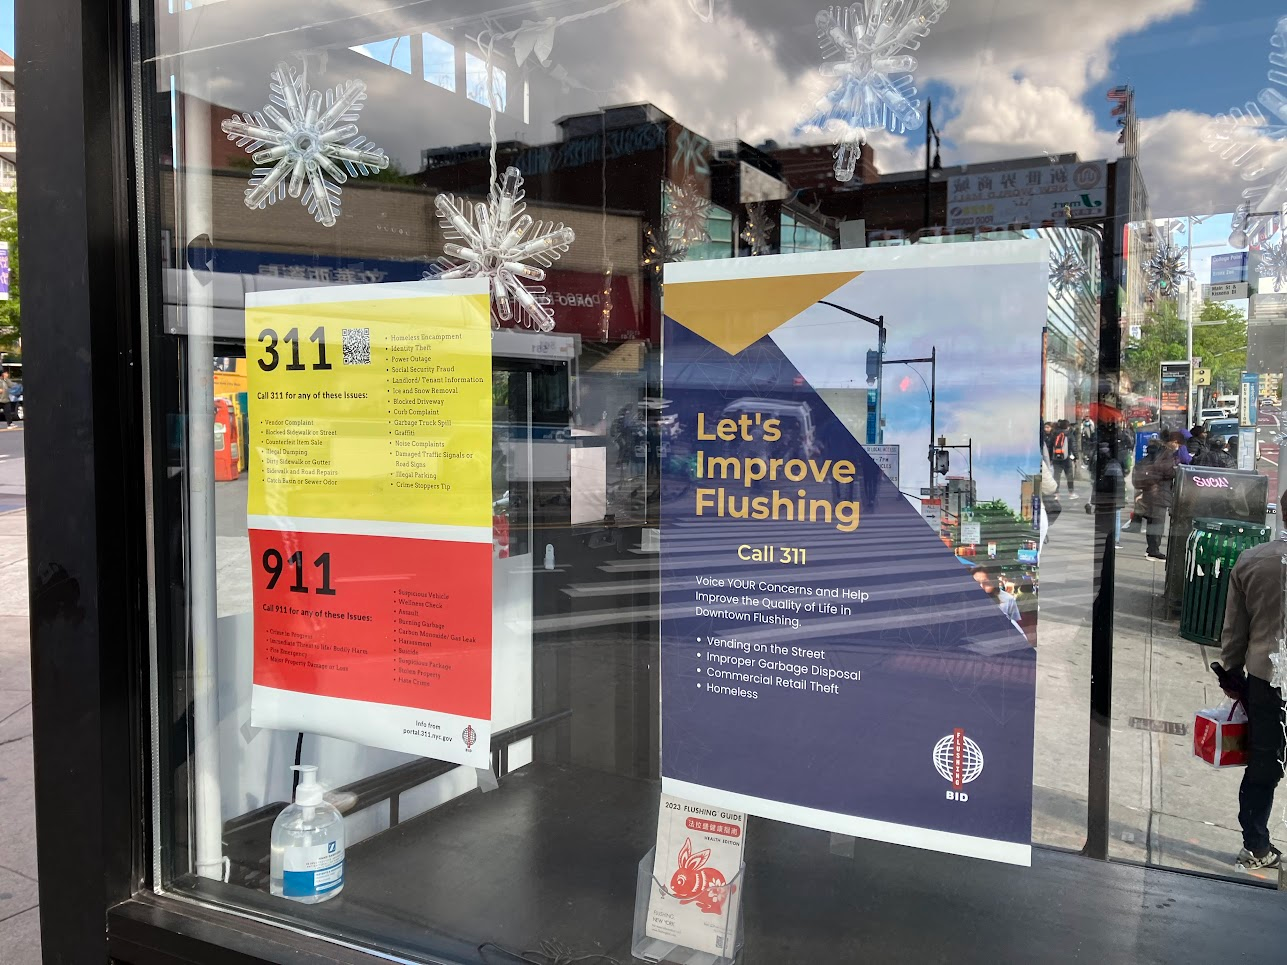
Posters from the Flushing BID telling residents to voice their concerns and help import the quality of life by reporting select issues to 311, credit: Zhi Keng He
Along with Community Boards’ own service request systems, housing data, and other civic projects, here are some steps I have seen and used to help push for changes that use 311 and create engagement around the issues.
- Always submit a 311 complaint. Even if it seems trivial, getting a record of the incident in the data is important.
- Research how the request will get resolved. In some cases, some FAQs hint at the systems in play in agencies like the DOHMN’s Rat Complaints, which showcases which buildings were inspected in the last 6 months.
- Follow up with a community board or your local or state elected official. Both provide wonderful resources and have dedicated staff to elevate the issue and help the community member navigate to the correct workflows. Some also meet with an agency liaison monthly. (i.e., NYPD Build A Block meetings)
- Use tools
- Reported: This system automates reporting of unsafe drivers and OATH statuses.
- Explore data with context. ANHD DAP and JustFix’s Who Owns What provide tools to view building complaints, violations, and evictions to guide outreach to tenants and build cases of tenant harassment.
- Another instance of adding context is an analysis that combined 311 flood complaints with the Stormwater Flooding dataset to identify affected areas that weren’t included in the model.
- There are also multiple ways to generally explore 311 data: NYC 311 Reports, BoardStat, and San Francisco GPT provide ways to view 311 data and find trends.
- Collect your own data with pictures/videos, sensors, pen, paper, or other tools (Google Forms, Survey123)
- Some examples: Heatseek & Community Flood Watch
- Organize with neighbors, and civic organizations, and work with the press, community boards, and electeds to come up with fixes to city policy and budget.
Zhi Keng He is a Master of Urban Planning student at Hunter College and Data Lab Manager at BetaNYC, a non-profit organization that works to improve the lives of New Yorkers through open data, design, and technology. His work focuses on digital storytelling and building tools to elevate lived experiences and foster community engagement and capacity.